1. The economy has strengthened but the recovery is slowing
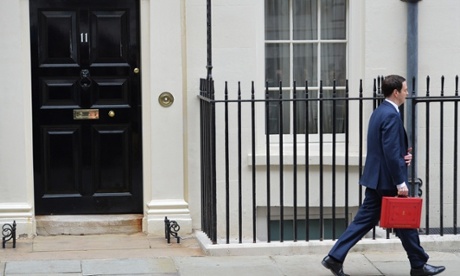
The UK’s economic recovery appears established, with quarterly growth averaging 0.6% since the beginning of 2013. As the chart above shows, the path for growth has diverged from expectations in 2010, when George Osborne got the keys to No 11.
Forecasts made back in 2010 by the newly created Office for Budget Responsibility (OBR), the Treasury’s independent economic forecaster, turned out to be overly optimistic. For 2012, the OBR was predicting growth of 2.8%. Annual growth that year was 0.7%. By 2014, it was looking much better for the OBR, whose forecast was just 0.1 points off.
Growth of 2.6% last year was the strongest since 2007 and outpaced the rest of the G7 economies (more on that below). That is expected to be as good as it gets for the foreseeable future, with growth set to slow over the next couple of years, partly because of a weak outlook for the eurozone, Britain’s main trading partner.
2. The UK economy is one of the G7’s top performers
UK growth in 2014 was strong by international standards. As the graphic above shows, at 2.6%, the increase in GDP was faster than any other G7 economy. The chancellor will undoubtedly emphasise this point as he gives his budget speech , and it will be repeated in the run-up to the election, as the economy remains a key battleground.
GDP up 0.5%: recovery is on track & plan is protecting Britain from the economic storm. 2.6% growth in 2014 fastest of any major economy
— George Osborne (@George_Osborne) January 27, 2015
But the chancellor is unlikely to be able to make the same boast for 2015. The International Monetary Fund is predicting UK growth of 2.7% this year, relegating the British economy to second place behind the US. The world’s largest economy is expected to grow by 3.6%.
3. Unemployment has fallen faster than expected
Unemployment increased by less than expected during the recession, never hitting the three million mark feared by policymakers and economists. As the graphic above shows, unemployment fell sharply in 2013, with the jobless rate falling from 8% at the beginning of the year to below 7% by early 2014.
It now stands at 5.7% – the lowest since the summer of 2008 before the collapse of Lehman Brothers and before the full force of the financial crisis was unleashed on the global economy.
By comparison, eurozone unemployment is 11.2%, with the highest rates in Greece at 26% and Spain at 23.4%. The jobless rate in Germany meanwhile is just 4.7%, and 10.2% in France. The US rate is 5.7%, on a par with the UK.
While the fall in unemployment is undoubtedly a good thing, it masks less positive trends in the labour market, such as a dismal productivity performance and persistently weak wage growth.
4. But a big jump in self-employment has driven the rise in employment
As George Osborne attempts to woo the public in his final budget before the election in May, the rise in employment under his watch is likely to feature heavily.
However, while an increase in employment is to be celebrated, the headline numbers do not tell the full story of a big jump in self-employment and the rise of zero-hours contracts.
Zero-hours workers earn nearly £300 a week less than permanent employees http://t.co/HOjzFOj7Nn
— TUC Media Team (@TUCnews) December 15, 2014
Analysis by the Office for National Statistics has shown that self-employment in the UK was higher in 2014 than at any point in the past 40 years, at 4.6m or 15% of the workforce. The ONS chart above shows, of the 1.1m increase in the number of people employed between the first quarter of 2008 and the second quarter of 2014, 732,000 were self-employed.
The increase can partly be explained by people choosing to work for longer in self-employed roles, but also by an inability of some self-employed workers to find work as an employee.
5. Pay is only just starting to outpace inflation
British workers suffered six years of falling real wages between 2008 and 2014. It meant that households remained under financial pressure long after the recession was officially over, as inflation consistently outpaced wage growth.
The Bank of England has made it clear that after the biggest squeeze in living standards in modern times, it is watching pay growth closely. Policymakers led by the bank’s governor Mark Carney have indicated they are unlikely to raise interest rates before real wage expansion has gathered momentum.
As the graphic above shows, British workers started enjoying real pay rises towards the end of last year, as wages picked up and inflation started to fall. That trend is expected to gather steam this year as economic recovery continues and inflation – currently just 0.3% – remains low.
6. Borrowing has come down (but not as quickly as expected)
Deficit reduction is comfortable territory for the chancellor. The deficit – the gap between what the government receives in tax and what it spends – has come down since George Osborne took office, with government borrowing falling from £153bn in 2009-10 to £97.5bn in 2013-14 according to the OBR.
But weaker-than-expected tax receipts (partly as weak wage growth has weighed on income tax revenues) has left the chancellor way behind on his original deficit-reduction plans, despite public spending cuts. In his first, emergency budget in June 2010, borrowing was expected to be £37bn in 2014-15. It is now expected to reach £91.3bn, according to the OBR’s most recent forecasts.
Osborne will undoubtedly repeat his well rehearsed claim that the government’s long-term economic plan is working, but deficit reduction has been slow and another dose of austerity will be required once the election is over.
