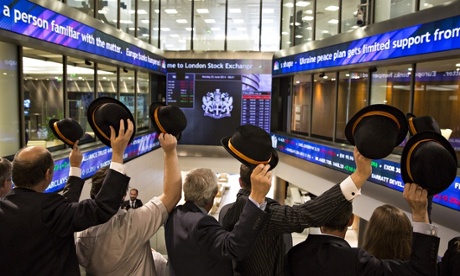
Why has it hit a record high?
To mash up a Clinton-era phrase, it’s the global economy, stupid. UK economic growth for 2014 is expected to come in at 2.7% when figures are released later this week. The US grew by 2.4%, and despite reports of permanent recession in Europe, Germany notched up a surprise 0.7% gain in the last quarter of 2014.
But markets are driven by profit, not GDP growth, and profits have hit record highs. According to the Office for National Statistics, UK service firms achieved record profitability, as measured by their net rate of return, in the third quarter of 2014. Profits from manufacturing lag services, but have recovered rapidly from their 2009 low.
In the short term, fears of a Grexit have largely evaporated, while a trillion euro’s worth of quantitive easing in Europe is expected to push up asset prices.
In reality, most FTSE-listed companies make the majority of their profits overseas – so the US recovery has helped, as has translating those profits from dollars into pounds as sterling has fallen against the greenback (although not against the euro).
Why did it take so long to hit a new peak?
The FTSE recession, so to speak, has been among the longest on record. It last peaked on 30 December 1999 and briefly poked its nose through the 6,700 level in October 2007 before crashing to 3,530 in March 2009.
Irrational valuations on stocks during the 1998-2000 tech bubble, the China-led commodity boom and the pre financial crisis debt-fuelled spending spree all drove stocks to previous highs, and the (still continuing) unwinding of these bubbles has held the FTSE back.
Other markets reached their pre-2000 peaks earlier than the FTSE, with the S&P500 on Wall Street breaking new levels in 2014. The German Dax went through its former peak in March 2013 and is now nearly 40% above that level. Blame the FTSE’s heavy weighting in oil and commodity stocks for its laggardly performance. But it’s worse in Tokyo, where the Nikkei remains painfully below its bubble-era December 1989 peak of 38,957. It now stands below 18,500.
Does it make me better off?
Yes and no. The days when the FTSE was a barometer of the nation’s industrial strength are long gone. Less than half of the money in UK pension plans is now invested in UK stocks. The biggest shareholders in FTSE 100-listed companies are often US hedge funds or other overseas institutions rather than traditional holders such as Prudential, Standard Life and Aviva, who have sold many of their UK holdings, transferring assets into bonds – or investing overseas themselves.
But that said, it is still a boon to most savers who, when they see their next pension statements, should see comfortably higher figures and potential payouts.
Although the index has taken nearly 15 years to recover, shareholders have also enjoyed the benefit of dividends over the period. £1,000 invested in FTSE 100 stocks at the start of 2000 is now worth £1,669, according to analysis by Hargreaves Lansdown.
Is this a signal to sell?
It certainly was the last time, in 2007, when the FTSE nearly regained its peak. The “headwinds” are strong; the oil price fall has knocked 20% off BP’s share price since last summer, and 15% off Shell’s. BHP Billiton, the Anglo-Australian mining giant, is down 25% since last July as commodity prices have fallen in general.
The general election in May hangs like a cloud of uncertainty over the FTSE 100, in particular with overseas investors, who currently are allocating to continental Europe rather than the UK.
But there are as many “tailwinds”, chiefly continued perky economic growth, high levels of employment, signs of real wage growth and the boost to spending from falling oil prices.
One comforting figure is the price-earnings (p/e) ratio, which compares the price of shares with the amount of profits earned by companies. On this measure, the FTSE 100 is only half the price it was in 2000.
The current p/e of the FTSE 100 is 16 times earnings, which compares with the height of nearly 30 times in December 1999. But it does mean that it is slightly above the long-term average of 15, which is telling you that shares are neither cheap nor expensive.

